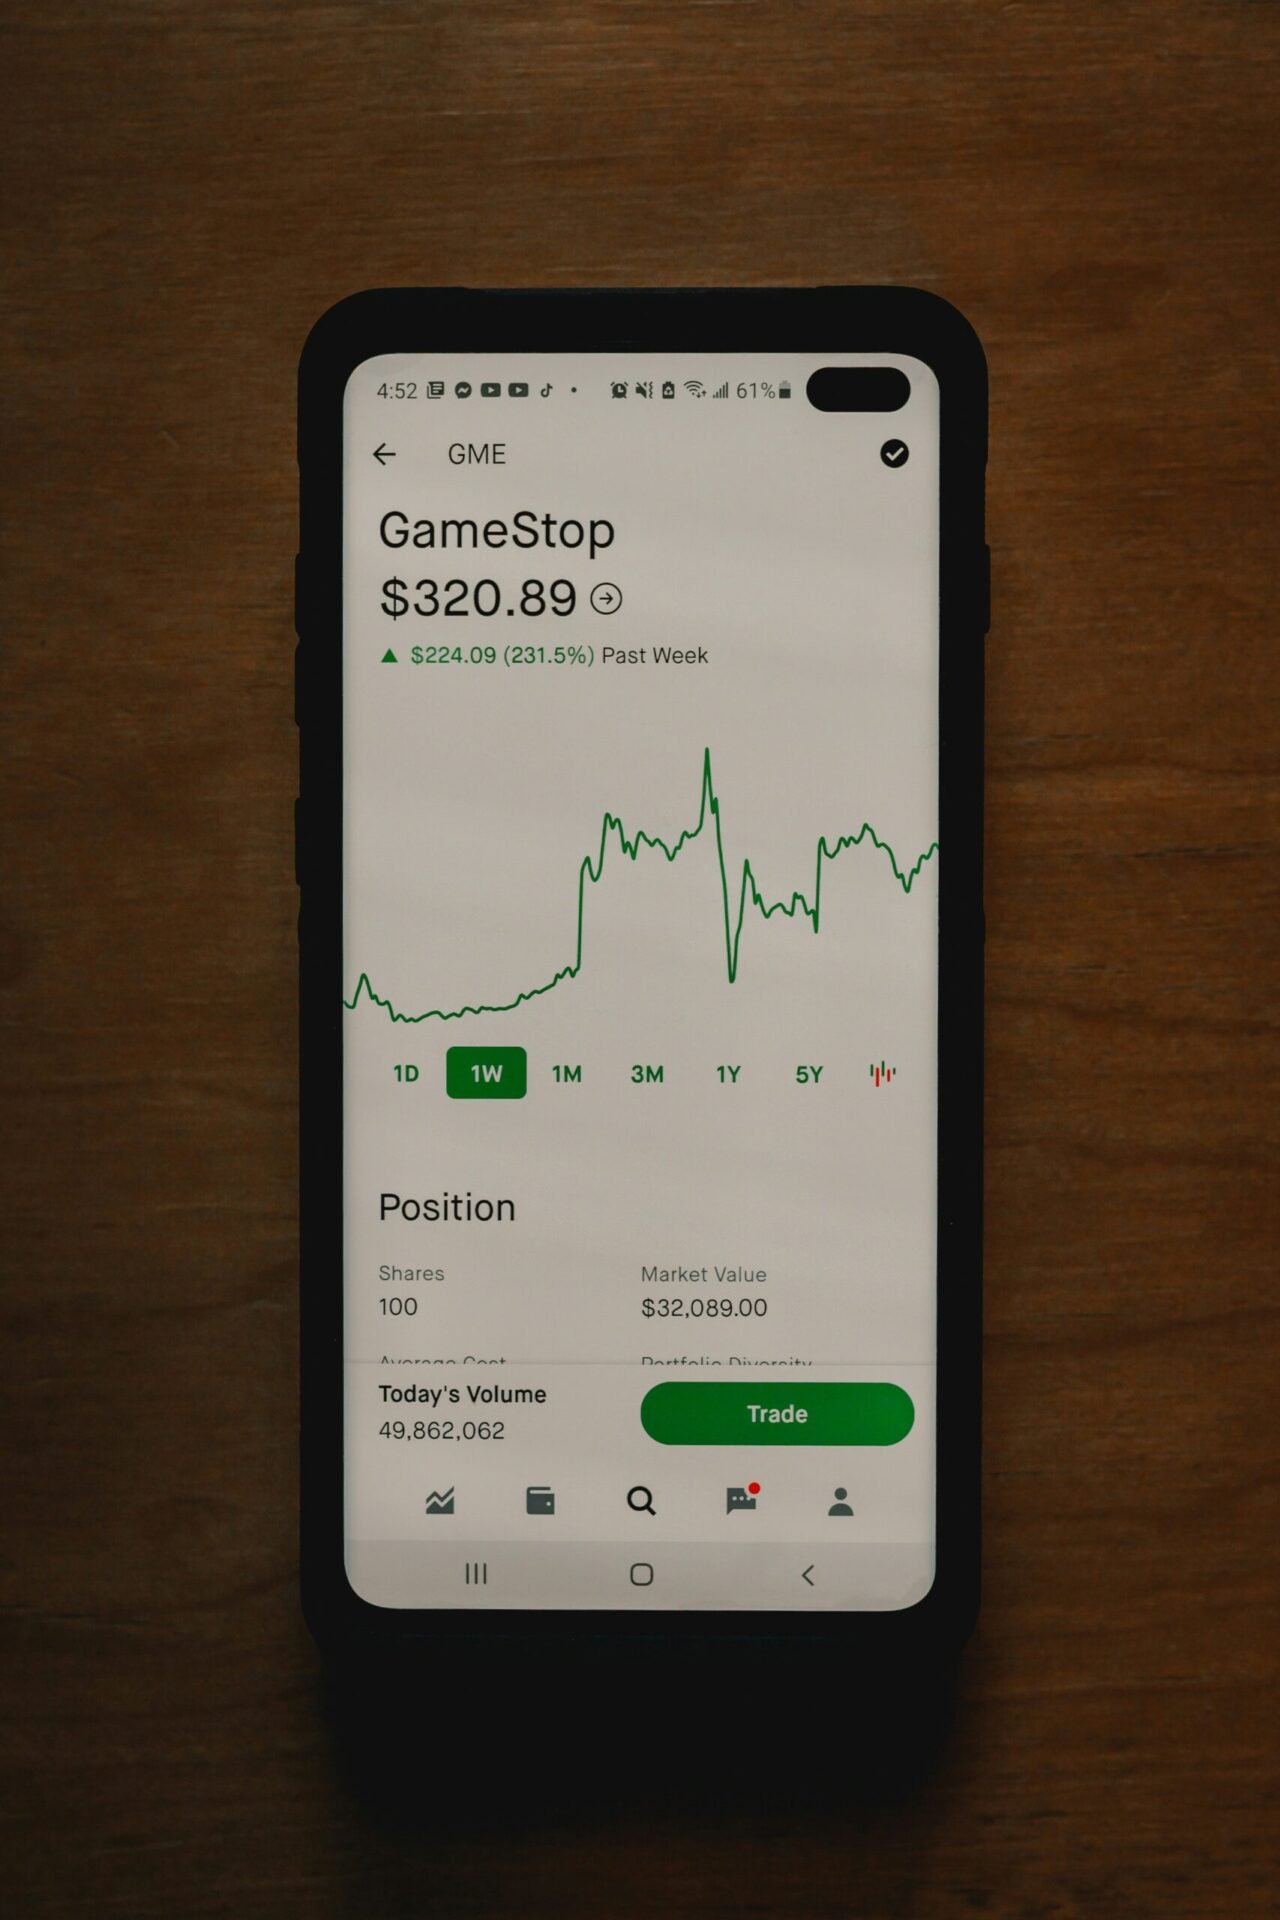
When it comes to trading in the financial markets, having a clear and reliable trading signal is essential. A trading signal is a trigger or indicator that suggests the opportune time to buy or sell an asset. By using trading signals, traders can make more informed decisions and improve their chances of success.
In this article, we will explore five different trading signals that traders can use to enhance their trading strategies:
1. Moving Average Crossover
The Moving Average Crossover is a popular trading signal that uses two moving averages of different time periods. When the shorter-term moving average crosses above the longer-term moving average, it generates a buy signal. Conversely, when the shorter-term moving average crosses below the longer-term moving average, it generates a sell signal. This signal is commonly used in trend-following strategies.
2. Relative Strength Index (RSI)
The Relative Strength Index (RSI) is a momentum oscillator that measures the speed and change of price movements. It ranges from 0 to 100 and is typically used to identify overbought and oversold conditions in the market. When the RSI crosses above 70, it suggests that the asset is overbought and a sell signal may be generated. Conversely, when the RSI crosses below 30, it suggests that the asset is oversold and a buy signal may be generated.
3. Bollinger Bands
Bollinger Bands consist of a middle band, which is a simple moving average, and an upper and lower band that are calculated based on standard deviations. The width of the bands expands and contracts based on market volatility. When the price touches the upper band, it suggests that the asset is overbought and a sell signal may be generated. Conversely, when the price touches the lower band, it suggests that the asset is oversold and a buy signal may be generated.
4. MACD (Moving Average Convergence Divergence)
The MACD is a trend-following momentum indicator that shows the relationship between two moving averages of an asset’s price. It consists of a MACD line, a signal line, and a histogram. When the MACD line crosses above the signal line, it generates a buy signal. Conversely, when the MACD line crosses below the signal line, it generates a sell signal. Traders often use the MACD to identify potential trend reversals.
5. Fibonacci Retracement
Fibonacci Retracement is a technical analysis tool that uses horizontal lines to indicate potential support and resistance levels based on the Fibonacci sequence. Traders use Fibonacci retracement levels to identify potential entry and exit points. When the price retraces to a Fibonacci level, it suggests that the asset may reverse its trend, generating a buy or sell signal depending on the direction of the retracement.
It is important to note that no trading signal is foolproof, and traders should always consider other factors such as market conditions, risk management, and fundamental analysis. Additionally, it is recommended to backtest and validate any trading signal before incorporating it into a live trading strategy.
In conclusion, trading signals can be valuable tools for traders to make informed decisions in the financial markets. The Moving Average Crossover, Relative Strength Index (RSI), Bollinger Bands, MACD, and Fibonacci Retracement are just a few examples of trading signals that traders can use to enhance their trading strategies. By understanding and utilizing these signals effectively, traders can increase their chances of success in the dynamic world of trading.

Be First to Comment